The Dashboard That Died Every Night: Hunting React Memory Leaks

Memory leaks are invisible in the demo, invisible in code review, invisible in your test suite — and then very visible in week two of production, when someone's tab has been open for 40 hours. Most React apps get away with leaking because users navigate away before it matters. The apps that can't get away with it are the ones that never reload: dashboards, kiosks, trading screens, monitoring walls.
Why React leaks feel different
You rarely leak by forgetting free(). You leak by keeping a reference alive so the garbage collector never gets permission to collect. In React apps, the references that outlive their welcome cluster into five patterns — and each one has a signature you can learn to spot in a heap snapshot.
Pattern 1: subscriptions without cleanup
The classic, still the most common. Every addEventListener, setInterval, socket handler, or SDK subscription made in an effect needs a symmetric teardown:
useEffect(() => {
  const onResize = () => setCols(computeCols(window.innerWidth));
  window.addEventListener("resize", onResize);
  const id = setInterval(pollDockStatus, 15_000);
  return () => {
    window.removeEventListener("resize", onResize); // ✅ symmetric
    clearInterval(id);
  };
}, []);
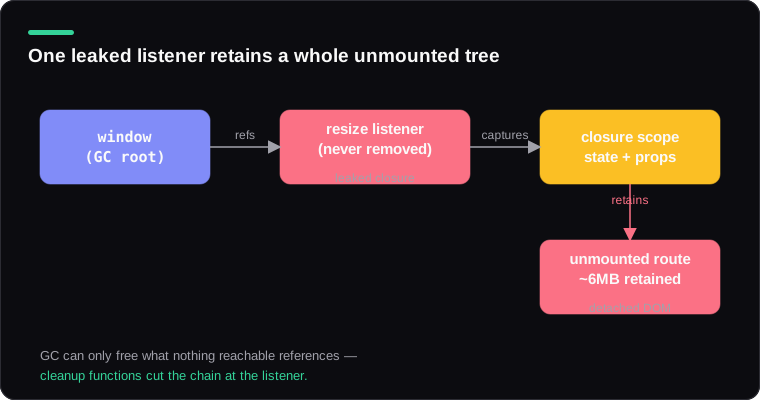
The insidious part isn't the interval itself — it's what the closure retains. A leaked listener holds its closure; the closure holds component state; the state holds the props; the props hold... In our heap snapshots, one leaked resize listener retained an entire unmounted route, 6MB at a time.
Pattern 2: module-level caches that only grow
Our 3am culprit. The dashboard cached shipment detail lookups in a module-level Map to avoid refetching as views cycled:
const shipmentCache = new Map<string, ShipmentDetail>(); // ❌ grows forever
A distribution centre processes tens of thousands of shipments a day. The cache had no eviction, and a Map at module scope is a GC root — nothing it holds can ever be collected. Every cycle of the wallboard added entries. The fix was boring and completely effective — a tiny LRU:
const shipmentCache = new LRUCache<string, ShipmentDetail>({
  max: 500,
  ttl: 10 * 60 * 1000,
});
Any unbounded collection you write is a leak with a delivery date. Map for identity-keyed metadata has a leak-free alternative: WeakMap, which lets keys be collected.
Pattern 3: detached DOM held by refs and libraries
Imperative libraries — charts, maps, video players — attach to a DOM node and keep internal references to it. Unmount the React component without calling the library's own destroy method, and the node leaves the document but not the heap: a detached DOM tree.
useEffect(() => {
  const chart = echarts.init(ref.current);
  chart.setOption(buildOptions(data));
  return () => chart.dispose(); // ✅ without this, the canvas + tree leak
}, []);
In DevTools, search a heap snapshot for Detached — detached nodes are the smoking gun of this pattern, and the retainer chain tells you which library is holding them.
Pattern 4: closures captured by long-lived things
Promise chains that never settle, AbortControllers never aborted, debounced functions holding their last arguments, analytics queues holding event payloads. Individually small; multiplied by a re-rendering app, large. The rule: anything with a lifetime longer than a component must not capture that component's scope — pass it minimal data, not closures.
Pattern 5: the leak that isn't yours
Session-replay snippets, chat widgets, A/B testing SDKs. On the logistics dashboard, a vendor tag was retaining every DOM mutation record "for replay." We couldn't fix its code; we could exclude the kiosk build from loading it. Always test with third-party scripts disabled before burning days on your own code.
The forensic loop
The process that found our leak, reusable verbatim:
- Prove it and measure the rate.
performance.memorysampled every minute, charted. Ours was a clean 40MB/hour line — a steady slope means a leak on a timer or event; a step function means a leak per user action. - Three-snapshot technique in Chrome DevTools: snapshot → let the suspect flow run (for us: one full wallboard cycle) → snapshot → run it again → snapshot. Compare 2→3, filtered to objects allocated between 1 and 2 that are still alive — that intersection is your leak, with the noise of one-off allocations removed.
- Read retainer chains bottom-up. Pick the biggest retained object, walk up until you hit something you recognize — a variable name, a component, a library namespace. The first recognizable frame is usually the fix site.
- Fix, then re-run step 1. Leaks come in layers; ours had the Map and a disposed-less chart. The slope tells you when you're actually done.
The wallboards have now run for months without a nightly death. The postmortem's best line came from the night supervisor who'd been rebooting screens manually at 3am: "So the fix was... you stopped keeping everything?" Yes. That's the whole discipline, honestly.
Keep Reading
09 Jul 2026
Maximum Update Depth Exceeded: A Field Guide to Infinite Render Loops
08 Jul 2026
The Search Box That Showed the Wrong Results: Effect Race Conditions
12 Jul 2026
Streaming That Doesn't Stream: Fixing Suspense Waterfalls in Next.js
11 Jul 2026
"use client" Creep: How Our Server-First App Quietly Became a 1.2MB SPA